Using the Data Tool
The definitive guide to using Ninety's Data tool to organize and monitor your team's KPIs.

Written by Tommy Mains
Updated at August 18th, 2025
-
 Insights
-
 Data
Data
-
 Rocks
Rocks
-
 To-Dos
-
 Issues
-
 Meetings
-
 Headlines
-
 Vision
-
 Org Chart
-
 1-on-1
-
 Directory
-
 Knowledge Portal
-
 Assessments
-
 Integrations
-
 Account Options and Troubleshooting
-
 Mobile
-
 Partner Hub
-
 Maz
Maz
Table of Contents
The Data Tool
The Data tool simplifies setting up and managing your team’s Scorecard to keep track of goals on five levels:
- Organization-wide
- Leadership Team
- Departmental
- Teams
- Individuals
Reviewing the Data tool every week is a critical function of team meetings.
Operating Scorecards According to Your User Role
The functionality of the Data tool changes based on each user's role in Ninety. Click here for a basic understanding of user permissions for this tool. In short, all licensed users can view and operate their assigned KPIs, while users with Manager or higher level permissions can add KPIs and groups to Scorecards and adjust settings.
Data Tool Overview
Use the Data tool![]() to organize your team's key metrics into KPI groups, set targets, and monitor progress with Weekly, Monthly, Quarterly, and Annual Scorecards.
to organize your team's key metrics into KPI groups, set targets, and monitor progress with Weekly, Monthly, Quarterly, and Annual Scorecards.

What Are KPIs
A Key Performance Indicator (KPI) is a quantifiable metric used to evaluate the success of an organization, team, or Seat in meeting agreed-upon performance objectives. While KPIs are metrics, not all metrics are KPIs. KPIs are only the most essential (or key) metrics.
Learn more about making data a superpower for your organization with our free On Data Guide.
Navigating the Data Tool
Navigating the Data Tool
Scorecard Filters
Use the following filters to display your KPIs the way that works for you and your team.

Team Dropdown
Many users are part of multiple teams in Ninety; ensure you have the correct team selected on the Team dropdown.
View By Dropdown
Use the View by dropdown to choose how you want to view your data: by week, month, quarter, or year. This determines how your KPI data is grouped and displayed in columns.
- Week — Display data in individual weekly columns (default for Weekly Scorecards).
- Month (read-only) — Display prorated data aggregated by calendar month.
- Quarter (read-only) — Display prorated data aggregated by calendar quarter.
- Year (read-only) — Display prorated data aggregated by calendar year.
When you select Month, Quarter, or Year views, Ninety dynamically displays prorated data based on your weekly entries. This means that weeks spanning multiple time periods are automatically split proportionally — so each month, quarter, or year receives accurate, calendar-aligned data without requiring manual exports or calculations.
Learn more about how prorated data works below.
How Rollup Data Is Displayed

How each KPI displays rollup data is determined in its details panel. When you're creating a New KPI or modifying an existing KPI (by clicking its row to open its details panel), adjust how rollup data is displayed in the Target section of the details panel.
By default, KPIs will total their values after selecting one of the read-only View by filters. Some KPIs, such as those with a percentage as their target, should be changed to the average setting.
To change how an existing KPI displays its rollup data:
- Navigate to the intended KPI.
- Click it to open its details panel.
- Scroll down to the Target section.
- Click the Show rollup data as dropdown.
- Select Average or Total from the options shown.
The View by filter adjusts how your existing Scorecard data is displayed. It does not convert Weekly KPIs into Monthly, Quarterly, or Annual KPIs, which remain separate entities in your respective Scorecards.
Date Range Dropdown
Select the time period you want to analyze. Each Scorecard has its own default setting, and you can select any option from the dropdown:
- Custom — Define a specific date range.
- Last 13 Weeks — View the most recent 13 weeks of data (default for Weekly Scorecards).
- QTD (Quarter to Date) — View data from the beginning of the current quarter to today.
- YTD (Year to Date) — View data from the beginning of the current fiscal year to today.
- Current Quarter — View data for the entire current quarter.
- Current Year — View data for the entire current fiscal year.
The date range automatically adjusts based on your View by selection to ensure complete periods. For example, if you select "View by: Month" and "Date Range: Last 13 Weeks," Ninety fetches enough data to display complete months without partial periods at the beginning or end.
Ascending or Descending Toggle
Click the left arrow to view dates from the start of the reporting period to the end, or the right arrow to view dates from the end of the reporting period (often the current period) to the start.
Saving and Sharing Scorecard Views
The ability to save and share Scorecard views is a recent feature enhancehemnt (January 2026).
Ninety's Scorecard tool automatically saves your filter selections in the page URL, making it easy to return to specific views or share them with teammates.
When you change filters (such as the date range or team selection), the URL updates automatically. This means you can:
- Bookmark specific views — Save frequently used Scorecard filter configurations for quick access and sharing.
- Share filtered views — Send a Scorecard link to teammates with your exact filter selections already applied.
- Use browser navigation — Use your browser's back and forward buttons to navigate between recent filter options.
- Refresh without losing context — Your filter selections persist even after reloading the page.
Multiple Scorecards
The Scorecard tool gives each team in Ninety four Scorecards. Each Scorecard (Weekly, Monthly, Quarterly, and Annual) hosts its own set of KPIs, which are organized by groups.
KPIs cannot be automatically converted into another Scorecard. For example, Weekly KPIs cannot be displayed on the Monthly, Quarterly, or Annual Scorecards.
Rolling Up Weekly Data
The View by filter gives you the flexibility to analyze your Weekly Scorecard data at different time horizons without creating duplicate KPIs.
How it works:
- Select your Weekly Scorecard.
- Choose your desired View by option (Month, Quarter, or Year).
- Select your Date Range.
- Ninety automatically aggregates your weekly data into the selected time period.
When you roll up weekly data, the column headers display clean period labels (such as "Q1," "Q2," "Q3") instead of specific date ranges, making it easier to analyze trends over time.
Example: Rolling up a Weekly Scorecard to a quarterly view displays the same aggregated results as viewing a Quarterly Scorecard, providing consistency across different reporting levels.
Understanding Prorated Data for Weeks Spanning Multiple Periods
When you switch to Monthly, Quarterly, or Yearly views in the View by dropdown, Ninety automatically handles weeks that overlap between different time periods using prorated data calculations.
How It Works:
For weeks that span multiple months, quarters, or years, Ninety proportionally distributes the weekly data based on the number of days in each period.
Example: If a week runs from October 27 to November 2:
- 5 days fall in October (Oct 27-31).
- 2 days fall in November (Nov 1-2).
- Ninety assigns 5/7 of that week's data to October.
- Ninety assigns 2/7 of that week's data to November.
This prorated calculation ensures that:
- Monthly, quarterly, and yearly totals are aligned with the calendar and accurate.
- You don't need to export data or perform calculations manually.
- Each time period receives the appropriate share of weekly performance data.
Important Notes:
- Data is prorated at the weekly level (not at the daily level).
- The system splits weekly entries proportionally across the relevant time periods.
- This automatic calculation applies to all KPIs when viewing aggregated data.
Default KPIs On Scorecards
Ninety automatically adds 20 financial metrics to the Leadership Team's quarterly Scorecard. Click on each KPI to learn more from its details card.
These are items we have observed as being extremely important to company growth, including:
- Key financial metrics.
- Subjective performance ratings.
- Proficiency in each of the 9 Core Competencies.
All other Scorecards are blank when you create your account.
Organizing Scorecards with Groups
Organizing Scorecards with Groups
There are several ways to keep your team's Scorecards organized, including creating KPI groups and reorganizing KPIs.
Previously, you may have divided groups of KPIs with line breaks. Our updated tool automatically moved your KPIs into groups based on how you placed line breaks. With the Combine all groups button, you'll have a one-time option to combine all your KPIs into a single group.
Creating KPI Groups
Keep your Scorecards organized by creating groups. Each group can house similar KPIs to make reviewing your Scorecard as easy as possible. You can include up to 20 groups on each of your Scorecards. You may want to create a group for each team member, Seat, or goal. For example, a sales team may have a KPI group that includes a KPI from each sales Seat holder.

To create a new group:
- Click New Group on the far right of the Filters bar.
- Name the group.
- (Optional) Write a description for the group.
- Click Save.
To edit a group's details, click the ellipsis on the top right of the group's card. Then, click Edit group details. To delete it instead, click Delete group.
Expanding and Collapsing Groups
While viewing data, click the diagonal arrow to expand or collapse a group.
Reorganizing Groups
To manage the order of your KPI groups:
- Click the ellipsis on the far right of the Filters bar.
- Click Edit group order.
- Click and hold the six-dot icon on the left of the group's row to drag and drop groups in the popup.
- Click Save.
The order of your KPI groups carries over to your team's meeting agenda, so team leaders should organize the Scorecards accordingly.
Reorganizing KPIs
You can drag and drop a KPI within its group by clicking and holding the dots on the far left of the KPI's row and then releasing your click in its new location.

To send a KPI from one group to another:
- Right-click the KPI.
- Click Move to group… from the dropdown.
- Select a group from the dropdown.
- Click Move.
Creating and Updating KPIs
Creating and Updating KPIs
How to Create and Update KPIs in Ninety
KPIs (key performance indicators) are the quantifiable metrics your team tracks on its Scorecard to monitor performance against goals. To add a KPI to your team's Scorecard in Ninety, you can either create a brand-new one or add one that already exists in your organization. Owners, Admins, Managers, and Coaches can create and configure KPIs. Team Members can enter data for KPIs assigned to them but cannot create new ones. Observers have view-only access.
Who can create and edit KPIs
Your role in Ninety determines what you can do with KPIs on the Scorecard. Here's how permissions break down by role:
- Owners, Admins, and Coaches: Create, edit, and manage KPIs across all teams in your organization.
- Managers: Create, edit, and manage KPIs for every team you're assigned to.
- Team Members: Edit and manage KPIs for every team you're assigned to. You cannot create new KPIs or change KPI settings.
- Observers: View Scorecard data from your assigned teams. You cannot create KPIs or enter data.
If you don't see the New KPI button on your team's Scorecard, your role doesn't have permission to create KPIs. The button only appears for users with the Owner, Admin, Manager, or Coach role. To request a role change, contact your Admin or Owner — they can update your permissions through the Directory tool.
For the full permissions matrix, including what each role can and cannot do across every Scorecard feature, see Scorecard Permissions Explained.
How to create a new KPI
To create a new KPI, you'll work from within your team's Scorecard in the Data tool — not from the KPI Manager or the global Create button at the top of the app. The New KPI button lives on each group's card inside the Data tool.
- Click Data from the left navigation.
- Select your team from the Team dropdown.
- Select the Scorecard timeframe you want the KPI to belong to (Weekly, Monthly, Quarterly, or Annual).
- Click the New KPI button at the top right of the group's card.
- Select Create New KPI from the dropdown.
- Enter a title for your KPI.
- Choose a unit type (Number, Currency, Percentage, Yes/No, or Time).
- Set a goal and goal orientation (greater than, less than, or equal to the goal).
- Assign an owner (the person accountable for this metric).
- Click Save.
Important: unit type is permanent. Once you enter data for a KPI, you cannot change its unit type. If you choose Percentage but meant to choose Currency, you'll need to create a new KPI with the correct unit type and re-enter your data. Choose carefully before saving. See the KPI unit types section below for details on each option.
Every team's Scorecard comes with four preset tabs: Weekly, Monthly, Quarterly, and Annual. The KPI you create belongs to whichever tab you're currently viewing. For example, to create a monthly KPI, switch to the Monthly tab first. You cannot convert a KPI to a different timeframe after creating it. Also note that the New KPI button is located on the group's card inside the Data tool, not the global Create button in the top-right corner of the Ninety app (which creates items like To-Dos and Issues).
Tip: create KPIs from the Data tool, not the KPI Manager. New KPIs are always created from within a team's Scorecard in the Data tool. Navigate to the team's Scorecard first, then use the New KPI button inside the group where you want the KPI to appear.
How to add an existing KPI to your Scorecard
If a KPI already exists in your organization (on another team's Scorecard, or previously created and then removed from a group), you can add it to your team's Scorecard without recreating it. Adding an existing KPI gives your team access to the same metric, including all of its historical data.
- Click Data from the left navigation.
- Select your team from the Team dropdown.
- Click the New KPI button at the top right of the group's card.
- Select Add Existing KPI from the dropdown.
- Search for the KPI by name.
- Check the box next to the KPI you want to add.
- Click Add.
You can also click the Add existing KPI link at the bottom left of the group's card to go directly to the search.
Important: adding existing creates a shared instance. When you add an existing KPI to your team's Scorecard, any data entered or edits made to that KPI will appear on every Scorecard where it's displayed. This is by design — it keeps data consistent across teams. If you need an independent copy with its own separate data, duplicate the KPI instead. For details on the difference between sharing and duplicating, see How to Share and Duplicate KPIs Across Team Scorecards.
How to edit a KPI
After creating a KPI, you can update its title, description, goal, goal orientation, and owner at any time. Editing a KPI's details does not affect its historical data.
- Click Data from the left navigation.
- Select your team from the Team dropdown.
- Click the KPI's title to open its details card.
- Make your changes — update the title, description, goal, goal orientation, or other fields as needed.
- Click Save.
Note: edits apply everywhere. If a KPI is shared across multiple teams' Scorecards, your edits to its title, description, goal, or other settings will appear on every Scorecard where it's displayed. This includes changes made by any user on any team.
Assigning or changing the owner after creation
If you forgot to assign an owner when creating a KPI, or if ownership needs to transfer to someone else, there are two ways to update it:
From the profile photo:
- Click the KPI's title to open its details card.
- Click the profile photo at the top right of the card.
- Hover over a Seat from the dropdown.
- Click the user who should own this KPI.
From the KPI Owner dropdown:
- Click the KPI's title to open its details card.
- Click the KPI Owner dropdown toward the bottom of the details card.
- Choose the new owner.
- If the user sits in multiple Seats, select the relevant Seat from the Seat dropdown.
To automate calculations using data from other KPIs, you can turn any KPI into a Smart KPI with a formula. For step-by-step instructions, see Using the Formula Builder.
Adding notes to a KPI's entry
All licensed users can add notes to KPIs. Having notes available to provide extra context for a KPI's progress over time helps save time in meetings by having documentation readily available.
To add a note to a KPI:
- Click Data from the left navigation.
- Choose your team from the dropdown.
- Choose a Scorecard (Weekly, Monthly, Quarterly, or Annual).
- Right-click a cell.
- Click Set custom Goal or note.
- Write your note.
- Click Save.
Editing any instance of a KPI changes it on every Scorecard.
How to move a KPI from one team to another

Your organization's KPIs are fully accessible across your account, allowing any team to add any KPI to their Scorecard. For example, if you want to have a KPI that's on the leadership team's Scorecard added to a department team's Scorecard, simply:
- Navigate to the Data tool.
- Select the intended team from the Team dropdown.
- Choose which group to add the KPI to or create a new group.
- Click New KPI at the top right of the group.
- Select add existing KPI from the options shown.
- Search for the KPI, check its box on the left side of its row, then click Add.
KPI unit types
Every KPI uses a unit type that determines how its data is displayed and calculated on the Scorecard. You select the unit type when creating a KPI, and it cannot be changed after data has been entered.
The five unit types are:
- Number. A whole number or decimal. Use this for counts, quantities, or any metric that doesn't require a currency symbol or percentage sign (for example, "Calls Made" or "Units Shipped").
- Currency. A monetary value displayed with a currency symbol. Supported symbols are $, €, and £. Use this for revenue, expenses, or any financial metric.
- Percentage. A value displayed with a percent sign. Use this for ratios, completion rates, or any metric expressed as a percentage of a whole.
- Yes/No. A binary value for tracking whether something was done or not done. Use this for completion-based metrics (for example, "Weekly Report Submitted" or "Team Huddle Held").
- Time. A value expressed in hours and minutes. Use this for duration-based metrics (for example, "Average Response Time" or "Hours Billed").
Important: unit type is permanent after data entry. Once you enter data for a KPI, its unit type is locked. If you chose the wrong unit type (for example, Percentage instead of Currency), the only option is to create a new KPI with the correct unit type, re-enter your data, and then remove or archive the old one. For help removing the old KPI, see Removing and Deleting KPIs.
Troubleshooting
Issue: I can't see the "New KPI" button. Solution: The New KPI button is only visible to users with the Owner, Admin, Manager, or Coach role. If you don't see it, your current role doesn't have permission to create KPIs. Check your role by opening your profile or asking your Admin. To request a role change, contact your Admin or Owner — they can update your permissions through the Directory tool.
Issue: I can't change a KPI's unit type (for example, from Percentage to Currency). Solution: Unit types are locked once data has been entered. To fix this, create a new KPI with the correct unit type, re-enter your data, and then remove or archive the old one. For help, see Removing and Deleting KPIs.
Issue: I created a KPI, but it's on the wrong timeframe (for example, weekly instead of monthly). Solution: Every team's Scorecard has four preset tabs — Weekly, Monthly, Quarterly, and Annual — and a KPI belongs to whichever tab you were viewing when you created it. You cannot move a KPI from one timeframe to another. To fix this, switch to the correct tab, create a new KPI there, and then remove the one on the wrong timeframe. For help removing KPIs, see Removing and Deleting KPIs.
Issue: A KPI I'm looking for doesn't appear in the "Add Existing" search. Solution: The search looks across all KPIs in your organization, but results depend on your team access. Try searching by the exact name of the KPI. If you still can't find it, the KPI may have been permanently deleted rather than just removed from a group. Check the KPI Manager for archived items, or contact support if you believe data was lost.
Issue: I edited a KPI and the change appeared on another team's Scorecard. Solution: If the same KPI appears on multiple teams' Scorecards (added using Add Existing KPI), it's a shared instance — edits to its title, goal, description, or other settings apply everywhere it's displayed. This is expected behavior. If you need an independent copy with its own settings and data, duplicate the KPI instead of sharing it. For details, see How to Share and Duplicate KPIs Across Team Scorecards.
KPI Examples
Ninety's leadership team recommends having every Seat in the organization own 3-5 KPIs. While KPIs can look different depending on your industry and many other factors, we wanted to offer some examples.
Net profit example
To create a pre-calculated metric tracking your company's Net Profit, you can create a smart KPI using pre-existing KPIs tracking your Total Revenue and Total Expenses over a given time period.
Step 1
First, you'll need to decide the time scope for your Net Profit KPI by selecting one of the following Scorecards:
- Weekly
- Monthly
- Quarterly
- Annual
Step 2
Next, create KPIs for Total Revenue and Total Expenses.
- Click Data from the left navigation.
- Click the desired Scorecard to add the KPIs to (Weekly, Monthly, Quarterly, or Annual).
- Click New KPI.
- Write the KPI's title.
- Add the KPI's owner using the person icon on the top left of the details card or with the corresponding dropdown.
- Write a goal for the KPI.
- Click Save.
- Populate any number of reporting periods for each KPI.
Step 3
Finally, create the Net Profit smart KPI.
- Click New KPI.
- Add a title, goal, and accountable team member.
- Toggle on Smart KPI.
- Click Add KPI.
- Click your Total Revenue KPI from the list.
- Click the minus (-) sign.
- Click Add KPI.
- Click your Total Expenses KPI from the list.
- Click Save.
The new KPI will automatically calculate your Net Profit for every reporting period, using data from the previous two KPIs.
Expenses as a percentage of revenue Example
To create a pre-calculated metric tracking your company's expenses as a percentage of revenue, you can create a smart KPI using pre-existing KPIs tracking your Total Revenue and Total Expenses over a given time period.
Step 1
First, you'll need to decide the time scope for your Expenses as a Percentage of Revenue KPI by selecting one of the following Scorecards:
- Weekly
- Monthly
- Quarterly
- Annual
Step 2
Next, create KPIs for Total Revenue and Total Expenses.
- Click Data from the left navigation.
- Click the desired Scorecard to add the KPIs to (Weekly, Monthly, Quarterly, or Annual).
- Click New KPI.
- Write the KPI's title.
- Add the KPI's owner using the person icon on the top left of the details card or with the corresponding dropdown.
- Write a goal for the KPI.
- Click Save.
- Populate any number of reporting periods for each KPI.
Step 3
Finally, create the Expenses as a Percentage of Revenue smart KPI.
- Click New KPI.
- Add a title, goal, and accountable team member.
- Toggle on Smart KPI.
- Click Add KPI.
- Click your Total Expenses KPI from the list.
- Click the division (/) sign.
- Click Add KPI.
- Click your Total Revenue KPI from the list.
- Click the multiply (*) sign.
- Click Add Number
- Type in “100”.
- Click the check mark or press your enter/return key.
- Click Save.
The new KPI will automatically calculate your Expenses as a Percentage of Revenue for every reporting period, using data from the previous two KPIs.
Frequently Asked Questions (FAQs)
What does it mean to own a Measurable?
To “own” a Measurable means to be accountable for its success. Each Measurable’s owner has their profile picture featured on the Scorecard. Measurable owners should create an Issue about their Measurable whenever it’s off track, needs updating, or has consistently surpassed its target.
How do I change a Measurable's owner?
There are two ways to change a Measurable’s owner:
- Click the Measurable to open its details card.
- Click the profile photo on the top right of the card.
- Hover over a Seat from the dropdown.
- Click one of the users who occupy that Seat.
Or:
- Click the Measurable to open its details card.
- Click the Measurable Owner dropdown toward the bottom of the details card.
- Choose a Managee.
- (Optional) Select the relevant Seat from the Seat dropdown if this user sits in multiple Seats.
What currencies are supported in the Scorecard?
A Measurable using currency for its goal can use one of the following symbols:
- $
- €
- £
What about OKRs, or how can I use a Scorecard to monitor my OKRs?
Objectives and Key Results (OKR) is a popular framework for focusing resources on completing specific goals. Our users can capture their OKRs as Rocks or goals in their team's Vision and turn several of the listed key results into Measurables to monitor on their Scorecard.
For example, if you're projecting an incoming growth and hiring period, you may want to ensure your onboarding process is effective, so you could have a version of the following OKR:
Objective: We will improve our onboarding process by the end of the quarter.
Key Results:
- Conduct stay interviews with existing team members.
- Create Seat-specific onboarding checklists.
- Obtain above 90% completion rates on onboarding checklists.
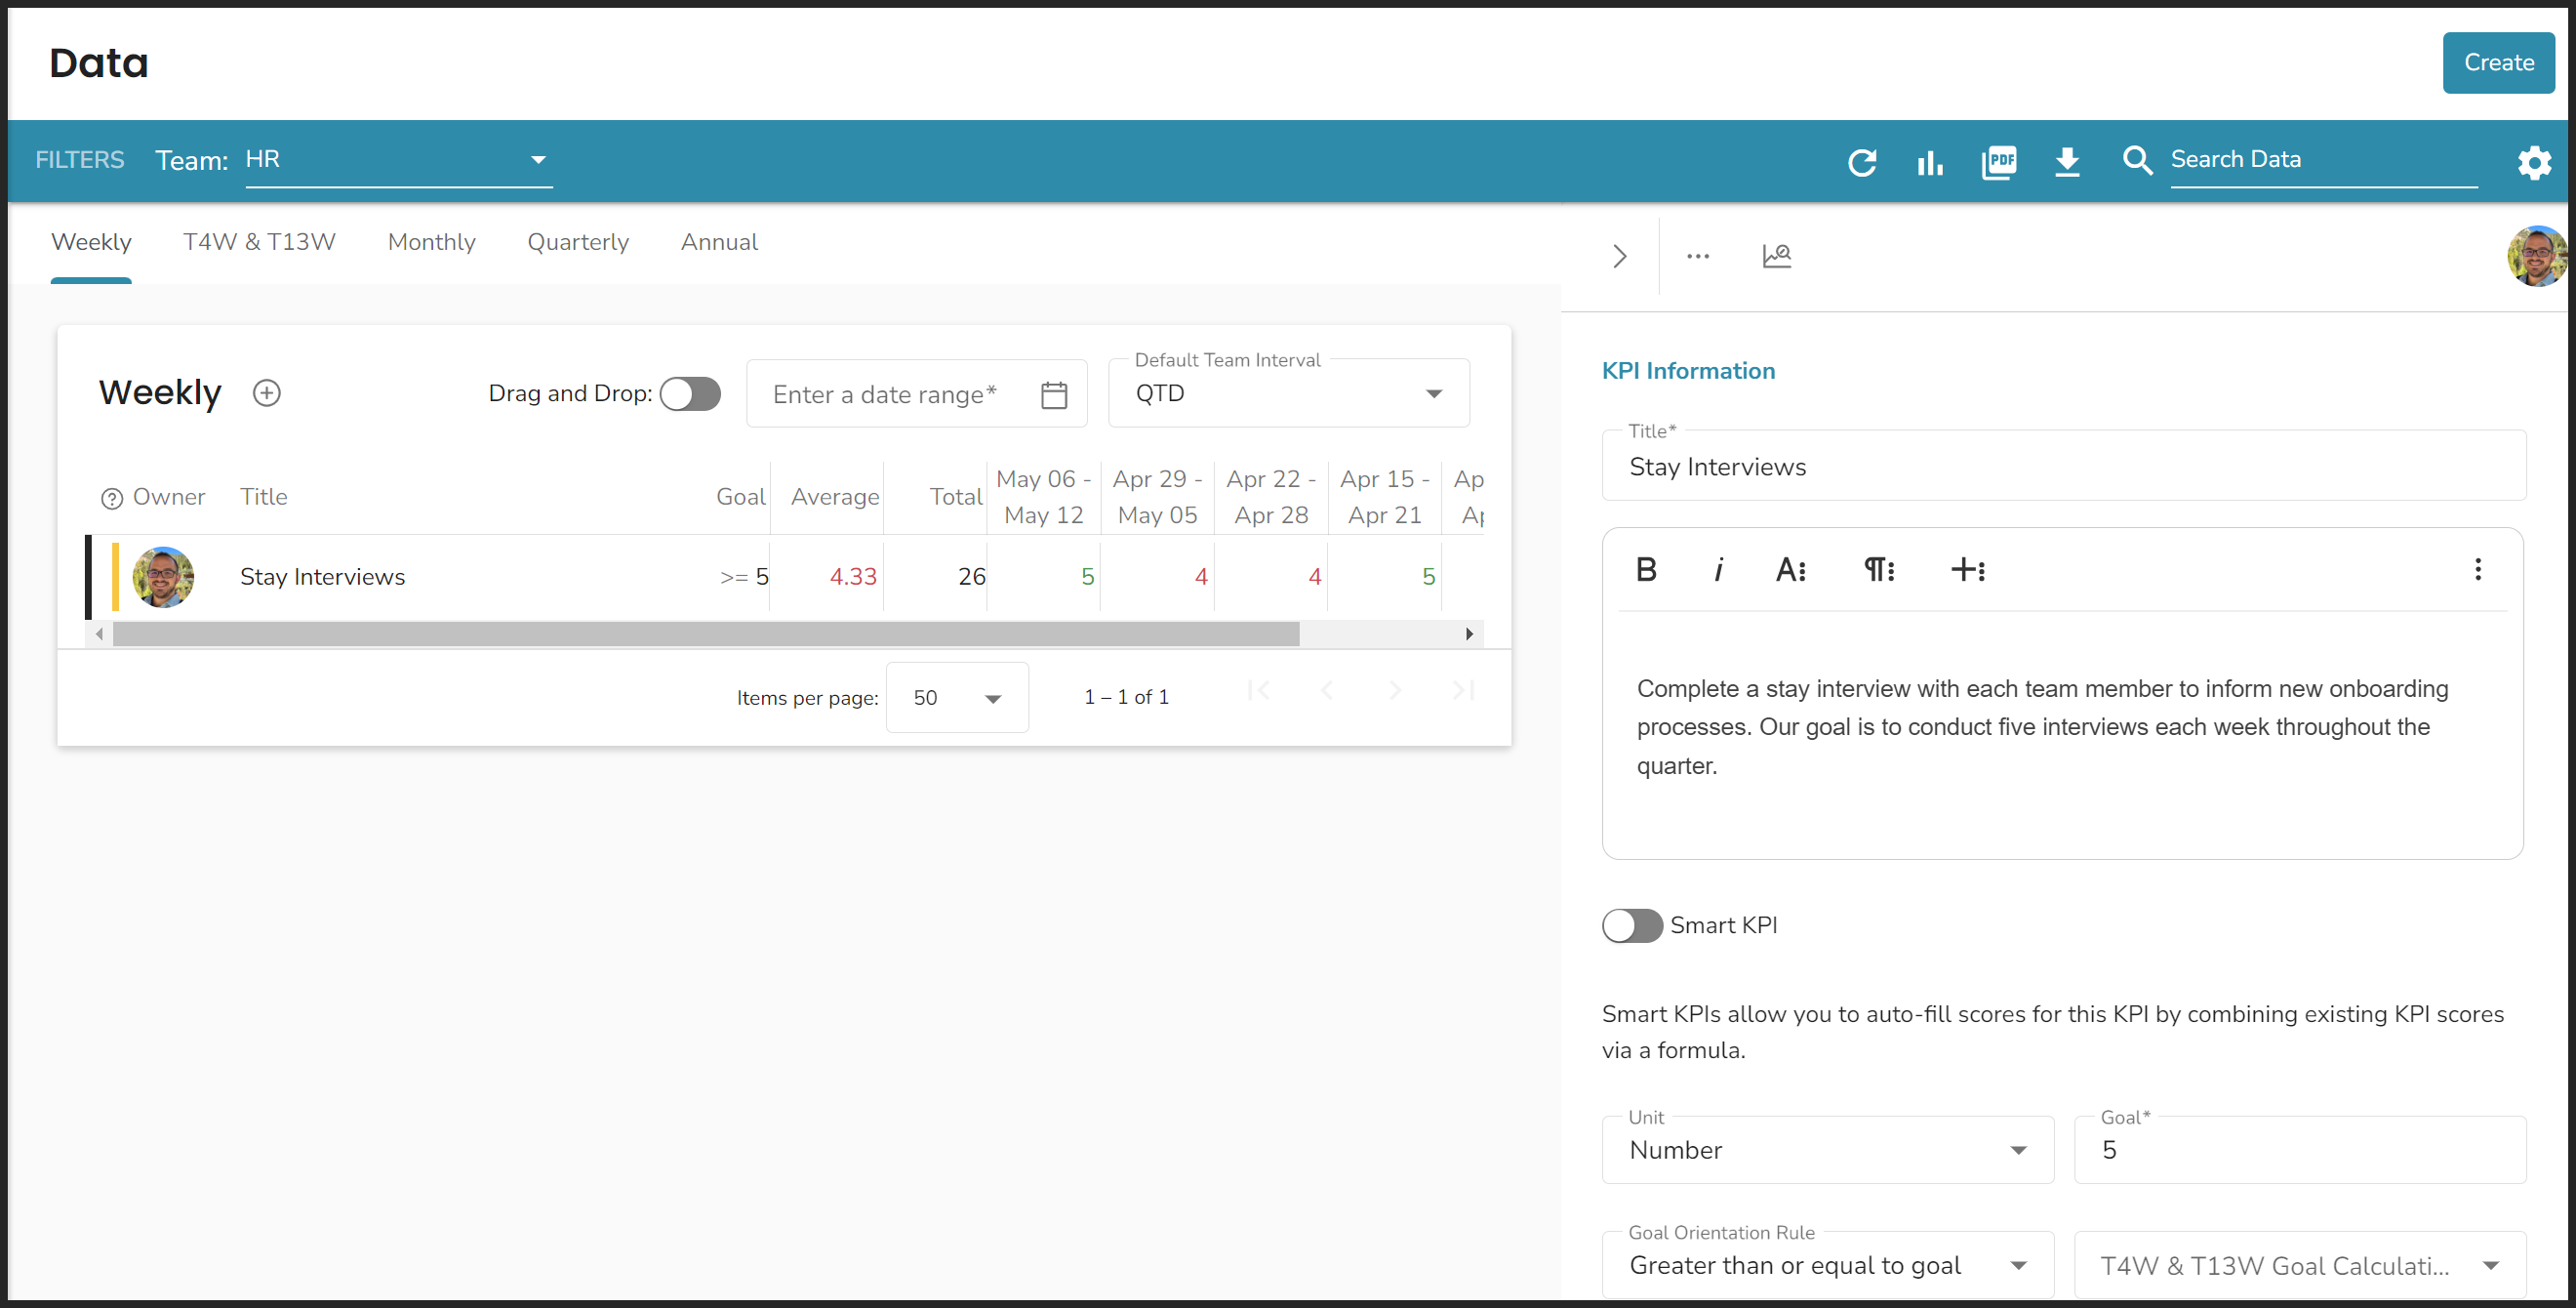
All three of these key results can be turned into Measurables. Here's an example of a Measurable from the first key result:
- Stay Interviews
- Description: Complete a stay interview with each team member to inform new onboarding processes. Our goal is to conduct five interviews each week throughout the quarter.
- Unit: Number
- Goal: 5
- Goal orientation: Greater than or equal to goal
Using the Formula Builder
Creating Smart KPIs
How to Use the Formula Builder in Ninety
The Formula Builder lets you create a math formula that automatically generates a KPI's score, using other existing KPIs as variables. It's most useful when a number on your Scorecard is already the result of other numbers you're tracking — for example, gross profit is always sales minus cost of goods sold, so there's no reason to enter it manually every week. Owners, Admins, Managers, and Coaches can add or edit Formula Builder KPIs.
Note: The Formula Builder was previously called Smart KPI. You may see "Smart KPI" in older documentation or session recordings.
To enable the Formula Builder on an existing KPI, open the KPI's details card and toggle on Formula Builder at the bottom. To create a new Formula Builder KPI from scratch, click New KPI, select Create new KPI, fill in the details, and toggle on Formula Builder before saving.
The Formula Builder supports four operators, including order-of-operations formulas with parentheses:
- Addition
- Subtraction
- Multiplication
- Division
Adding KPIs as variables
The Formula Builder lets you use any existing KPI in your account as a variable in a calculation. The KPIs you reference don't need to be on the same Scorecard — they just need to be actively maintained somewhere in your account (not archived).

Example: Gross Profit. You're already tracking Sales and Cost of Goods Sold on your Scorecard and want Gross Profit to calculate automatically.
- Click the Data from the left navigation.
- Click New KPI on the intended KPI group.
- Click Create new KPI.
- Name the KPI “Gross Profit.”
- Toggle on Formula Builder.
- Click Add KPI.
- Search for and click your existing "Sales" KPI.
- Select the subtract operator.
- Click Add KPI.
- Search for and click your "Cost of Goods Sold" KPI.
- Create a Goal.
- Assign an Owner.
- Click Save.
Variable limit: Each Formula Builder KPI supports a maximum of 25 KPI variables. Exceeding this limit doesn't produce an error message. Instead, the formula silently returns incorrect results. If your formula needs more than 25 variables, split the calculation across two or three Formula Builder KPIs and combine their results in a fourth.
Adding constant variables
Constants let you include a fixed number in your formula that stays the same every period.
Example: Daily Average. You track a weekly KPI and want the daily average calculated automatically.
- Click the Data from the left navigation.
- Click New KPI on the intended KPI group.
- Click Create new KPI.
- Name the KPI "Daily Average."
- Toggle on Formula Builder.
- Click Add KPI.
- Search for and click your existing "Weekly Sales" KPI.
- Click the division operator.
- Click Add Number.
- Enter 7 and click the checkmark.
- Create a Goal.
- Assign an Owner.
- Click Save.
Common formula examples
The following examples cover the Formula Builder patterns users ask about most. For each one, the formula assumes you've already enabled the Formula Builder toggle and are building your expression in the formula field.
Percentage of a total
Use the percentage of a total formula when you want to show what portion one KPI is of another. For example, closed deals out of total leads.
The formula: (Part KPI / Whole KPI) * 100
Here's how to build this example for your Scorecard: Click Add KPI and select your Part KPI, click the division operator, click Add KPI and select your Whole KPI, click the multiplication operator, click Add Number and enter 100, click the checkmark, then click Save.
Why multiply by 100? Division returns a decimal (for example, 0.21). Multiplying by 100 converts that to the percentage value you expect to see (21.0).
Percentage change between two KPIs
Use the percentage change between two KPIs formula to compare two values and show the difference as a percentage. For example, this period's revenue vs. last period's.
The formula: (Current KPI - Baseline KPI) / Baseline KPI * 100
Here's how to build this example for your Scorecard: Click Add KPI and select your Current KPI, click the subtract operator, click Add KPI and select your Baseline KPI, click the division operator, click Add KPI and select your Baseline KPI again, click the multiplication operator, click Add Number and enter 100, click the checkmark, then click Save.
Simple difference
Use a simple difference formula to show how much one KPI has grown or changed relative to another. For example, new customers this period minus churned customers.
The formula: KPI A - KPI B
Here's how to build this example for your Scorecard: Click Add KPI and select KPI A, click the subtract operator, click Add KPI and select KPI B, then click Save.
Daily average
Use this to divide a weekly total into a daily average automatically. See the Adding constant variables section above for step-by-step instructions.
The formula: Weekly KPI / 7
Formula behaviors to know before you build
Formulas recalculate retroactively. When you change a Formula Builder KPI's formula, the new formula recalculates all historical periods automatically — not just future ones. There's no way to preserve past calculated values when editing a formula. If you need to change a formula going forward while keeping historical data intact, the cleanest workaround is to archive the existing Formula Builder KPI and create a new one with the updated formula, starting from the current period.

Formula cells are locked by default. When a KPI has an active formula, its cells display a lightning bolt (⚡) icon and are locked for manual editing. The score is calculated automatically each period. If you need to enter a value manually for a specific period, open the KPI's details card and toggle Manual Override on. Note that manually entered values won't be recalculated by the formula unless you turn Manual Override back off.
Clearing formulas
There are two ways to remove elements from your formula:
- Click the Backspace button in the formula window to remove one element at a time, starting from the end of the formula.
- Click X (Clear All) to empty the formula field entirely.
Permissions needed
Owners, Admins, Managers, and Coaches can add or edit KPIs, including Formula Builder KPIs. Team Members can enter data for KPIs they're assigned to, but can't create or edit them.
Frequently asked questions
Do the KPIs I use as variables need to be on the same Scorecard?
No. Formula variables can reference any KPI in your account — including KPIs from other teams' Scorecards. As long as those KPIs are actively maintained somewhere in Ninety (not archived), the Formula Builder can access their data. This makes it possible to build a leadership-level KPI that rolls up values from individual team Scorecards.
What happens if a variable KPI is missing data?
If a KPI used as a variable is missing data for a given period or has been archived, the affected cells will display an "Invalid" error. Once data is entered for the missing period (or the KPI is restored from the archive), the "Invalid" error clears, and the formula recalculates.
Can I use KPIs from one Scorecard timeframe as variables in a formula on another timeframe — for example, weekly data in a monthly formula?
No. Formulas can only reference KPIs within the same timeframe. A weekly KPI can only be used as a variable in another weekly KPI's formula. A monthly formula can only reference monthly KPIs, and so on.
If you want to see weekly data rolled up into a monthly view, use the View by filter on the weekly Scorecard. Setting View by to Month or Quarter aggregates your weekly data without requiring a separate monthly KPI. Note that this view uses the weekly data you've already entered — it doesn't create a separate monthly KPI or allow a formula to read from it.
Can I use a goal value as a formula variable?
No. Formula variables can only reference the actual data values entered for a KPI, not the goal set for it. If you want to calculate something based on a target, create a separate KPI to hold the target value, enter the target as data, and then reference both KPIs in your formula.
Can I reference a previous period's value in a formula — for example, this week vs. last week?
No. The Formula Builder reads each variable KPI's value for the current period only. There's no lookback, lag, or running total function. To compare periods (for example, this week vs. last week), maintain a separate "prior period" KPI that you update each period manually with the previous period's value, then reference both your current KPI and the prior-period KPI in your formula.
For year-to-date or cumulative totals, the Formula Builder can't automatically calculate across periods. A workaround is to maintain a separate KPI as a running YTD tracker and enter the cumulative value manually each period.
Can I change a formula for future entries while keeping historical calculations unchanged?
No. Changing a formula rewrites the calculated values for all historical periods — not just the current one and beyond. To preserve historical data while using a new formula going forward, archive the existing Formula Builder KPI and create a new one with the updated formula, starting from the current period.
Troubleshooting
My formula cell shows "Invalid."
An "Invalid" error means one or more of your variable KPIs is missing data for that period or has been archived.
- Open each KPI used as a variable and confirm data has been entered for the affected period.
- Check whether any variable KPIs have been archived. Go to the KPI Manager to view archived KPIs and restore any that should still be active.
- Once the missing data is entered or the KPI is restored, the "Invalid" error will clear automatically.
If the issue persists, contact support.
My formula saved successfully, but no values are appearing in the cells.
- Confirm that all KPIs used as variables have data entered for the affected periods. The formula won't calculate for any period where a variable has no data.
- Try simplifying the formula temporarily to a single variable to identify which KPI may be missing data.
- Check whether your formula uses more than 25 KPI variables. Exceeding this limit causes the formula to produce incorrect or missing output without an error message. If needed, split the formula across multiple Formula Builder KPIs.
If the issue persists, contact support.
My formula is obviously returning incorrect values — for example, the same incorrect number repeating across all periods.
This is the most common sign that your formula references more than 25 KPI variables. The Formula Builder's 25-variable limit is silent: it doesn't show an error, but results become unreliable once the limit is exceeded.
- Count the number of KPI variables in your formula.
- If the count exceeds 25, split the calculation across two or three Formula Builder KPIs (for example, Group A total and Group B total), then combine those results in a fourth KPI.
If the issue persists, contact support.
My Formula Builder cell is locked, and I can't enter data manually.
Formula Builder KPIs locks manual data entry by default. The locked cell shows a lightning bolt (⚡) icon by the KPI's title. To enter data manually for a specific period:
- Open the KPI's details card.
- Toggle on Manual Override.
- Enter the value for the period.
Keep in mind that with Manual Override on, the formula won't recalculate for that period. Turn Manual Override off when you want the formula to resume calculating automatically.
My percentage formula shows the correct value in the weekly view, but the monthly or quarterly rollup shows a very different number.
This usually means the KPI's rollup setting is configured as Total instead of Average. Summing percentages across periods significantly inflates the result.
- Open the KPI's details card.
- Find the rollup setting and change it from Total to Average.
- Save the KPI.
The monthly and quarterly rollup values should now reflect the correct averaged percentage.
Customizing Your Team's Scorecards with Settings
Customizing Your Team's Scorecards with Settings
Users with Manager or higher permissions can customize their team's Scorecards with Settings.

To customize your team's Scorecard settings:
- Click the ellipsis on the far right of the Filters bar.
- Click Settings.
- Toggle off Use company default settings.
From there, you can adjust the settings described in the tabs below.
Show Current Period
To hide the current week’s column from your team’s Scorecard, toggle off Show current period.

KPI Status Indicator
When the KPI status colors toggle is toggled on, a new column appears on each Scorecard displaying a staus indicator icon. Click the icon to view a trendline for the KPI over the selected date range. The status indicator's color and symbol are based on each KPI's goal — often called its target.

Red indicates the KPI was off track for the previous three reporting intervals.
Orange indicates the KPI was off track at least once over the previous three reporting intervals.
Green indicates the KPI has been on track for the previous three reporting intervals.
Owner Column
Enabling the Owner column adds a column to all the team's Scorecards to show which user is accountable for each KPI.
Total Column
Enabling the Total column adds a column to all the team’s Scorecards to show the sum total of each KPI.
To change the number of reporting periods for the KPIs on a Scorecard, click the Periods dropdown on the Filters bar.
Average Column
Enabling the Average column adds a column to all the team’s Scorecards to show the average score of each KPI.
To change the number of reporting periods for the KPIs on a Scorecard, click the Periods dropdown on the Filters bar.
Goal Column
Enabling the Goal column adds a column to all the team’s Scorecards to show the goal (target) score of each KPI.
Resizing Columns
Click and drag to resize any of the following columns in a KPI group:
- Title
- Goal
- Average
You can also expand both the Goal and Average columns at the same time by clicking and dragging the line just before the printed year on the top row of a KPI group.
Double-click one of the above columns to instantly resize a column based on the length of its text.
Freezing and Hiding Columns
The Goal, Average, and Total columns are frozen, so they'll remain in place as your scroll horizontally through your data.
From the Data tool's settings, users with the manager role or above can hide any of the following columns from their team's Scorecard:
- Goal
- Average
- Total
- Owner
Company-Wide Settings
Admins, Owners, and Coaches can set company-wide Scorecard settings from the Configuration page in the Data section of Feature Controls.
Any teams using company default settings match the options here for:
- Average Column
- Total Column
- Status Color Indicator
Weekly Start Day
Previously, each team in your account could set their own weekly start day. This is now a company-wide setting. Here's how a user with a Admin, Owner, or Coach role can set your company's weekly start day for Scorecards:
- Click your name at the bottom of the left navigation.
- Click Company Settings from the popup.
- Click the Weekly start day dropdown.
- Select the day of the week that best fits your organization.
Changes in Company Settings are saved automatically.
The KPI Manager
The KPI Manager
How to Use the KPI Manager
Our KPI Manager is a centralized hub designed to simplify the way you manage your organization's KPIs. Accessible to users with Admin, Owner, or Coach roles only, this tool allows you to organize, filter, and update KPIs efficiently. With the ability to view all active and archived KPIs in one place, users can:
- Streamline the cleanup of outdated or irrelevant KPIs.
- Sort and filter KPIs by metadata like owner, last updated date, or location.
- Perform bulk actions to save time and effort.

Key Features Overview
The KPI Manager includes several robust features to enhance your KPI management experience:
- Comprehensive KPI List: View all active and archived KPIs across your organization.
- Filtering Options: Sort KPIs by owner, title, last updated date, or type (for example, Smart KPIs).
- Bulk Actions: Duplicate, archive, delete, re-assign, create a To-Do, or create a an Issue from one or more KPIs simultaneously.
- Detail Editing: Access detailed KPI information and make updates directly from the tool.
- Quick Actions: Use the ellipsis menu for individual KPI actions, such as editing or archiving.
Managing Your KPIs — Step-by-Step Instructions
To access the KPI Manager:
- Click Data from the left navigation.
- Click Go to KPI Manager on the filters bar.
Managing KPIs with Bulk Actions
Easily manage one or more of your KPIs by performing any of the following functions:
- Duplicate (copy)
- Archive (send to the archive)
- Delete (permanently remove)
- Re-assign (assign a new owner)
- Create a To-Do
- Create an Issue
To perform one of the above options:
- Click any number of the checkboxes shown in the first column of each KPI's row.
- Right-click one of the selected KPIs or click the Select Action button on the top right of the table.
- Choose an option from the dropdown.
Deleting a KPI will permanently remove it from your account. Consider archiving old or unused KPIs instead to continue referencing them in the future.
Use the "Show" dropdown at the bottom-right corner of the table to adjust how many KPIs are visible at a time. Selecting all checkboxes will only include the visible KPIs on the page.
To work with a single KPI, simply click the ellipsis on the far right of its row.
Filtering KPIs
Use the dropdowns and search textbox in the filters bar to sort your organization's KPIs. You can apply filters such as:
- Owner: Filter by specific KPI owners.
- Last Updated: Identify KPIs by their most recent activity.
- Type: Sort by Smart KPIs, currency metrics, or other classifications.
Combine multiple filters to quickly locate specific KPIs.
Creating
To create a New KPI from the KPI Manager:
- Click the New KPI button near the top right of the page.
- Fill in the required fields (such as title and owner).
- Click the Save button on the bottom of the panel.
Editing
To edit a KPI from the KPI Manager:
- Locate the intended KPI.
- Click anywhere on a KPI's row to open its details card.
- Update any field (such as owner, team, or location).
- Click the Save button on the bottom of the panel.
Archiving
The KPI Manager is the only place where you can archive a KPI.
To archive a KPI from the KPI Manager:
- Locate the intended KPI.
- Right-click the intended KPI.
- Select Archive from the dropdown.
If you start archiving a KPI that is part of a formula used in a smart KPI, you'll receive an extra warning explaining the archiving this KPI will cause invalid calculations for the smart KPI.

Frequently Asked Questions (FAQs)
Why can’t I see some KPIs in the manager?
Ensure you have the necessary permissions (Admin, Owner, or Coach) to access all KPIs.
What happens when I delete a KPI?
Deleted KPIs are permanently removed. If you accidentally deleted a KPI from your My 90 page or from the KPI Manager and need it recovered, reach out to our support team for assistance — we can recover most deleted items.
Use the archive option if you may need the KPI in the future.
Can I restore an archived KPI?
Yes, you can unarchive KPIs by accessing the archived list and updating their status.
What does “Last Reported” mean?
The "Last Reported" column shows the most recent date a value was entered for the KPI on a scorecard.
Bulk Actions in the Data Tool
Bulk Actions in the Data Tool
You can perform the following actions with one or more KPIs from a single group:
- Move to a different group (on the same Scorecard)
- Duplicate
- Create a To-Do
- Create an Issue
- Remove from the group (this option does not delete KPIs)
To perform one or more of the above actions:
- Click one or more checkboxes from KPIs on your Scorecard in the same group.
- Click the Select action button at the top of the same group.
- Choose the action.
How to Bulk Input KPI Data
Starting in November 2025, you can now bulk input KPI data for current or past reporting periods by copying multiple cells from another spreadsheet, such as from a platform like Google Sheets or Microsoft Excel, and pasting the data in the relevant KPI row(s) on your Scorecard. To copy and paste, use your keyboard's shortcut keys (Ctrl+C or Cmd+C to copy and Ctrl+V or Cmd+V to paste).
For example, if you have some KPI data stored in Google Sheets, here's how to bring it into Ninety to share on your team's Scorecard.
- Navigate to your team's Scorecard. In Ninety, click Data from the left navigation. Next, select the relevant team from the Team dropdown. Then, identify the KPI and/or KPI group to add values to. Finally, create new KPIs or modify existing KPIs if needed to match the data you want to paste into your Scorecard.
- Copy the data you want to add to Ninety. In Google Sheets (or other spreadsheet), highlight the cell(s) you wish to bring into Ninety. Then, copy the value(s) to your computer's clipboard by using your keyboard's shortcut keys (Ctrl+C on a PC or Cmd+C on a Mac), or you may be able to right-click the highlighted cells and select Copy from the options shown.
- Paste the data into Ninety. In Ninety, click the cell you want to paste a value into, or the first cell of a row you want to add several cells of data to. Then, use your computer's keyboard shortcut keys to paste the data (Ctrl+V on a PC or Cmd+V on a Mac). After a moment, your data will be live on your team's Scorecard.
Only the value displayed in the cell from where you're copying from will paste into Ninety, so comments or notes will not transfer over.
Bulk Input Troubleshooting
In this section, we'll address some common questions when bulk copying and pasting data into Ninety's Data tool.
Can I copy and paste data in the Scorecard widget on the My 90 page?
No, at this time, bulk actions such as copying and pasting values are not available on the My 90 page. Instead, you should navigate directly to your team's Scorecard in the Data tool.
Can I paste over existing scores?
Yes, you can paste over existing scores, so be sure you're copying the correct number of cells to your clipboard before pasting.
Can I copy data from my Scorecard in Ninety to paste somewhere else?
Yes, you can select/highlight the cells in a KPI's row to paste elsewhere.
Can I bulk-enter notes for my KPIs?
No, at this time, you cannot bulk-enter notes for KPIs.
Can I bulk input forecasted goal scores?
No, at this time, you cannot bulk-enter future scores for forecasted goals.
User Roles and Permissions
The permissions for each user role match other basic functionality of the Data tool. Licensed users can copy and paste data and use the undo and redo buttons for companies on a paid plan. Since Obsevers (free users) cannot edit KPI data, they also cannot perform any bulk actions.
Using the Undo and Redo Buttons

While you can use keyboard shortcuts for copying and pasting, our Data tool does not support using the keyboard shortcuts to undo recently added data or redo (reapply) recently removed data. Instead, use the undo and redo buttons as needed.Observers
For example, after adding a single entry to your KPI or pasting in multiple cells of data, you can click the undo button to clear those cells. Then, if you'd like to reapply the data, click the redo button.
Forecasting and Setting Custom Goals
Forecasting and Setting Custom Goals
Over time, you may need to adjust a KPI's target. We've developed a number of features so you can keep your Scorecards accurate and relevant to your team's needs.
How to Set a Permanent Future Goal/Target

Use the Set new future Goal feature to change a KPI's goal from a specific date forward. This method will maintain the integrity of your KPI under the previous goal while allowing you to monitor future progress better. This feature is not available for smart KPIs.
- Click Data from the left navigation.
- Choose your team from the dropdown.
- Choose a Scorecard (Weekly, Monthly, Quarterly, or Annual).
- Right-click the KPI's row anywhere to the left of the reporting periods.
- Select Set new future Goal from the dropdown.
- Enter a new target in the Goal field.
- (Optional) You may change the goal orientation rule with the dropdown.
- Click Save & Reload.
As noted in the popup, all previous scores will be automatically updated to be custom goals to reflect the previous target.
How to Set a Custom Goal for a Single Reporting Period
You can create a custom goal on a specific reporting period of a KPI to account for absences, holidays, and other exceptions.
To customize a KPI's goal for a single reporting period:
- Click Data from the left navigation.
- Choose your team from the dropdown.
- Choose a Scorecard (Weekly, Monthly, Quarterly, or Annual).
- Right-click a cell.
- Click Set custom Goal or note.
- Enter a custom goal number.
- Click Save.
Goal Forecasting
Modify the Date range dropdown to add forecasted targets for your KPIs. Either of the following date range options provides an opportunity to forecast goals (targets) for your KPIs:
- Current Quarter
- Current Year
Either selection adds additional blank cells to your Scorecard. You can enter a projected value for the KPI in any cell representing a future date.
For example, click the Date range dropdown on your weekly Scorecard and select Current Year. Then, each group on your Weekly Scorecard will have a cell for every week of the calendar year. When you click a cell of a future date, you can enter a custom goal for that reporting period; if the KPI's goal is a range, you'll enter a customized minimum and maximum goal for that reporting period.
Removing and Deleting KPIs
Removing and Deleting KPIs
Maintaining clean, relevant Scorecards is essential to the Data core competency. Teams should regularly review the KPIs on their Scorecards to ensure they're displaying the information the team needs to see at a glance to review:
- The health of the organization
- Progress on quarterly or annual goals
- Necessary analytics
Removing KPIs
There are two ways to remove a KPI from a Scorecard.
- Permanently delete a KPI
- Remove a KPI from a single Scorecard
Permanently Delete
Only a KPI's owner can delete it.
- Click My 90 from the left navigation.
- Right-click the KPI you want to delete.
- Click Delete KPI from Scorecard.
- Click I understand… Delete anyway.
Deleting a KPI removes it from each Scorecard it's on, any Processes it's linked to, and your Vision if it's used there.
Remove from a Scorecard
To remove a KPI from a Scorecard, any licensed user on the team can:
- Click on the checkbox of the KPI you want to remove.
- Right-click the KPI.
- Click Remove from group.
What to do if your Scorecard data appears missing
If your Scorecard is showing "No data to show" or KPIs have disappeared from a team, the most common causes and recovery paths are below.
If a KPI was removed from a Scorecard (but not deleted)
Removing a KPI from a Scorecard does not delete it or its historical data — it just removes it from that team's view. You can add it back using the Add Existing KPI option:
- Go to your Scorecard and click New KPI.
- Select Add Existing KPI.
- Search for the KPI by name.
- Check the box next to it and click Add.
All historical scores will reappear once the KPI is back on the Scorecard.
If a KPI was permanently deleted
Permanently deleting a KPI from the KPI Manager removes it and its historical data and cannot be undone from within Ninety. If this happened, contact support. In some cases, the technical team can restore deleted data from the backend, though this is not guaranteed.
If your Scorecard data disappeared after reordering groups
If data disappears after you open the group order window and switch between groups (even without saving changes), this is a known product issue. Contact support immediately and include the name of the affected team. The technical team can restore Scorecard groups and KPIs from the backend.
If the Scorecard shows "No data to show" but KPIs are still listed
This typically means scores haven't been entered for the visible time period, or the Scorecard filter is set to a period with no data. Check that you're viewing the correct team, time period, and Scorecard type (Weekly, Monthly, or Quarterly) before assuming data is missing.
Printing and Exporting Scorecards to PDF
Printing and Exporting Scorecards to PDF
The data you put into Ninety is yours. Any licensed user can print their team's Scorecards or export them to a downloadable PDF.

How to Export Scorecards to a PDF
Follow these steps to create a PDF containing all the KPI groups on the selected Scorecard.
- Click Data from the left navigation.
- Use the Team dropdown to choose the relevant team.
- Select one of the team's Scorecards (Weekly, Monthly, Quarterly, or Annual).
- Select the desired date range from the Date range dropdown.
- Click the ellipsis at the far right of the filters bar (
 ).
). - Select Print PDF (
 ) from the dropdown.
How to Print the PDF
Once you have downloaded the PDF, follow these steps to print it:
- Open the file using a PDF viewer such as Adobe Acrobat, Preview (Mac), or a web browser.
- Go to file> Print or press Ctrl + P (Windows) / Cmd + P (Mac) to open the print dialog.
- Ensure the correct printer is selected.
- Choose the appropriate page size.
- Set orientation (Portrait/Landscape) based on the layout.
- Adjust margins and scaling if necessary for better readability.
- Click Print to complete the process.
Exporting Your Scorecards to a Spreadsheet
Exporting Your Scorecards to a Spreadsheet
Exporting your team's Scorecards to a .csv file to load in spreadsheet applications is simple. Follow the steps below to try it yourself.

Exporting Scorecards to a .csv File
To export one of your team's Scorecards into a .csv file:
- Click Data from the left navigation.
- Use the Team dropdown to choose the relevant team.
- Select one of the team's Scorecards (Weekly, Monthly, Quarterly, or Annual).
- Select the desired date range from the Date range dropdown.
- Click the ellipsis at the far right of the filters bar ().
- Select Export as CSV from the dropdown.
The exported spreadsheet has one tab containing the following information:
- KPI group name
- Status
- Title
- Description
- Owner
- Goal
- Average
- Total
- Reporting period date(s)
Frequently Asked Questions (FAQs)
What happened to trailing Scorecards?
We've made trailing Scorecards easier than ever; you can still view your KPIs in trailing 4- or 13-week intervals to see trends over time.
The trailing scorecard was a temporary solution in the previous iteration of the Data tool. You can achieve a similar effect by clicking the Period dropdown and selecting 4-week (read-only) or 13-week (read-only).
How do I change a KPI's owner?
There are two ways to change a KPI's owner:
- Click the KPI's title to open its details card.
- Click the profile photo on the top right of the card.
- Hover over a Seat from the dropdown.
- Click one of the users who occupy that Seat.
Or:
- Click the KPI's title to open its details card.
- Click the KPI Owner dropdown toward the bottom of the details card.
- Choose a Team Member.
- (Optional) Select the relevant Seat from the Seat dropdown if this user sits in multiple Seats.
What does it mean to own a KPI?
To “own” a KPI means to be accountable for its success. Each KPI's owner has their profile picture featured on the Scorecard. KPI owners should create an Issue about their KPI whenever it’s off track, needs updating, or has consistently surpassed its target.
How do I move a KPI from one group to another?
To move a KPI from one group to another:
- Right-click the KPI.
- Click Move to group… from the dropdown.
- Select a group from the dropdown.
- Click Move.
How do I enter my KPI's scores?
All licensed users can be assigned KPIs and input data for any of their team's KPIs. Input scores for your KPIs from the My 90 page or the Data tool page. The My 90 workspace shows all the KPIs you own across every team.
To add scores in My 90:
- Click My 90 from the left navigation.
- Scroll to the Scorecard section.
- Type in your scores to the corresponding KPI and reporting period cell.
- Click the Period Interval dropdown to access your Trailing, Monthly, Quarterly, and Annual Scorecards.
To enter scores using the Data tool:
- Click Data from the left navigation.
- Choose a team from the Team dropdown.
- Click another Scorecard tab to switch away from the Weekly Scorecard.
- Locate the KPI.
- Type the score in the reporting period cell.
- Press your tab key to move one cell to the right or press shift + tab to move one cell to the left.
Does an empty week indicate that a goal was “missed”?
Yes, if a reporting period is left blank, the goal would be counted as “missed” for that reporting period.
Does the status indicator take custom goals into account?
Yes, the status indicator does take custom goals into account.
What timezone is used to calculate score periods?
The Data tool uses the UTC timezone to calculate reporting periods.
When does each quarter start? How is the quarter start date determined?
- Q1 (First Quarter): Starts on January 1st
- Q2 (Second Quarter): Starts on April 1st
- Q3 (Third Quarter): Starts on July 1st
- Q4 (Fourth Quarter): Starts on October 1st
Can I set the Annual Scorecard to a customized fiscal year instead of the calendar year?
Setting a customized fiscal year is not currently possible. We’d love to hear from you if this feature would benefit your organization. Submit a feature request to help raise its priority.
To submit a feature request, click Provide Feedback from the bottom of the left navigation.
How do I remove the current week from appearing on my Scorecard?
To remove the current week from your Scorecard:

- Click Data from the left navigation.
- Choose your team from the dropdown.
- Click the gear icon on the right of the Filters bar.
- Click the Hide current week toggle on.
What about OKRs, or how can I use a Scorecard to monitor my OKRs?
Objectives and Key Results (OKR) is a popular framework for focusing resources on completing specific goals. Our users can capture their OKRs as Rocks or goals in their team's Vision and turn several of the listed key results into KPIs to monitor on their Scorecard.
For example, if you're projecting an incoming growth and hiring period, you may want to ensure your onboarding process is effective, so you could have a version of the following OKR:
Objective: We will improve our onboarding process by the end of the quarter.
Key Results:
- Conduct stay interviews with existing team members.
- Create Seat-specific onboarding checklists.
- Obtain above 90% completion rates on onboarding checklists.
All three of these key results can be turned into KPIs. Here's an example of a KPI from the first key result:
- Stay Interviews
- Description: Complete a stay interview with each team member to inform new onboarding processes. Our goal is to conduct five interviews each week throughout the quarter.
- Unit: Number
- Goal: 5
- Goal orientation: Greater than or equal to goal
How do I share a Scorecard or Scorecard group with another team?
Currently, you cannot duplicate a full team's Scorecard or group of KPIs to another team's Scorecard tool. If you'd like to submit a request for this feature, click Provide Feedback from the left navigation.
However, you can add KPIs created/added to your team's Scorecard to a group on any other team's Scorecard.
To add a Measurable from another team's Scorecard or a previously created KPI to your team's Scorecard, click Add existing KPI at the bottom left of the card, or:
- Click the New KPI button on the top right of the group's card.
- Click Add Existing KPI.
- Search for and then click the KPI you wish to add.
- Click Add.